Improving Provenance Data Interaction for Visual Storytelling in Medical Imaging Data Exploration
Abstract:
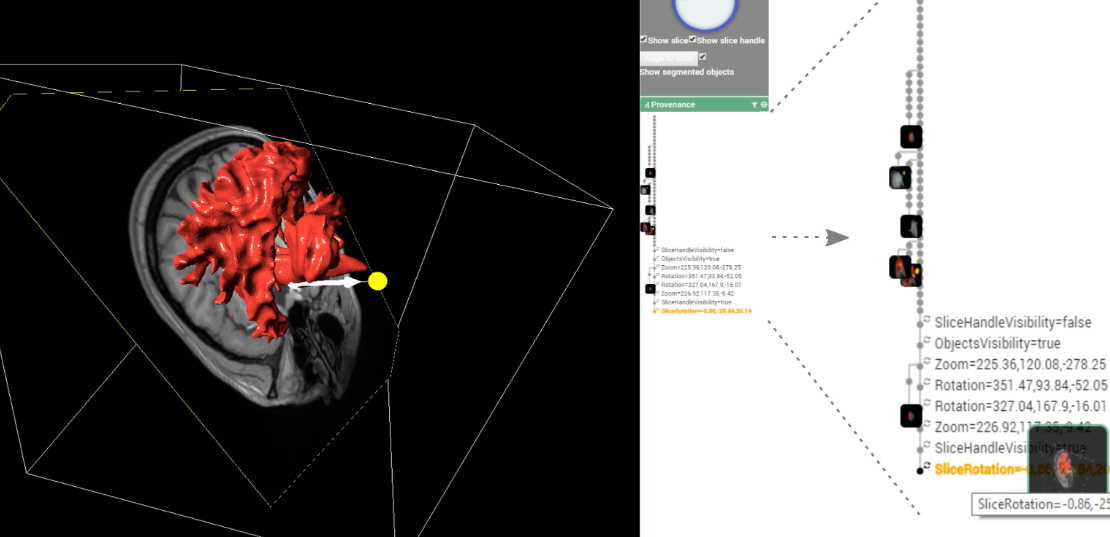
Effective collaborative work in diagnostic medical imaging is not trivial due to the large amounts of complex data involved, a (non-linear) workflow involving experts in different domains, and a lack of versatility in the current tools employed in healthcare. In this paper, we aim to introduce how the integration of visual storytelling techniques together with provenance data in the analytic systems used in medicine can compensate for these issues, by enhancing communication of results and reproducibility of findings through diagnostic provenance data. To this end, we illustrate how we can improve the interaction with provenance data displayed in a graph in order to facilitate authoring and the creation process of visual data stories.
Main reference:
L. Amabili, J. Kosinka, M. A. J. van Meersbergen, P. M. A. van Ooijen, J. B. T. M. Roerdink, P. Svetachov, and L. Yu. 2018. Improving provenance data interaction for visual storytelling in medical imaging data exploration. In Proceedings of the Eurographics/IEEE VGTC Conference on Visualization: Short Papers (EuroVis '18). Eurographics Association, Goslar, DEU, 43–47.
BibTeX:
@inproceedings{3290776.3290786,
author = {Amabili, L. and Kosinka, J. and van Meersbergen, M. A. J. and van Ooijen, P. M. A. and Roerdink, J. B. T. M. and Svetachov, P. and Yu, L.},
title = {Improving provenance data interaction for visual storytelling in medical imaging data exploration},
year = {2018},
publisher = {Eurographics Association},
address = {Goslar, DEU},
abstract = {Effective collaborative work in diagnostic medical imaging is not trivial due to the large amounts of complex data involved, a (non-linear) workflow involving experts in different domains, and a lack of versatility in the current tools employed in healthcare. In this paper, we aim to introduce how the integration of visual storytelling techniques together with provenance data in the analytic systems used in medicine can compensate for these issues, by enhancing communication of results and reproducibility of findings through diagnostic provenance data. To this end, we illustrate how we can improve the interaction with provenance data displayed in a graph in order to facilitate authoring and the creation process of visual data stories.},
booktitle = {Proceedings of the Eurographics/IEEE VGTC Conference on Visualization: Short Papers},
pages = {43–47},
numpages = {5},
location = {Brno, Czech Republic},
series = {EuroVis '18}
}