SlicerAstro: a 3-D interactive visual analytics tool for HI data
Abstract:
SKA precursors are capable of detecting hundreds of galaxies in HI in a single 12-hour pointing. In deeper surveys, one will more easily probe faint HI structures, typically located in the vicinity of galaxies, such as tails, filaments, and extraplanar gas.
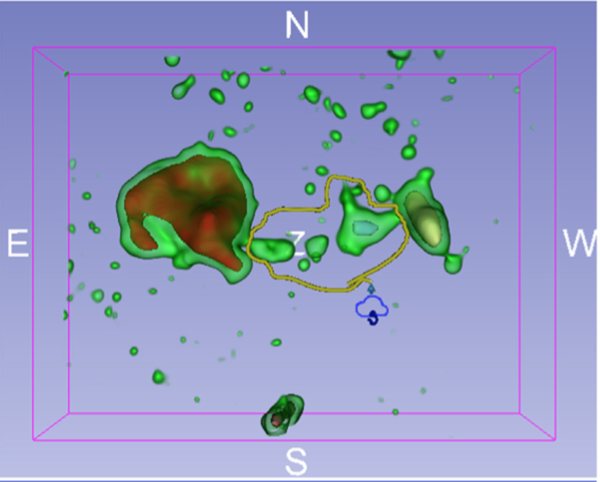
The importance of interactive visualization in data exploration has been demonstrated by the wide use of tools that help users receive immediate feedback when manipulating the data. We have developed a 3-D interactive viewer with new analysis capabilities, based on traditional 2-D input/output hardware. These capabilities enhance data inspection, allowing faster analysis of complex sources than with traditional tools. This viewer is an open-source extension of a multi-platform open-source software package for visualization and medical image processing.
We demonstrate the capabilities of the current stable binary release, which offers the following features: (i) handling of FITS files and astronomical coordinate systems; (ii) coupled 2-D/3-D visualization; (iii) interactive filtering; (iv) interactive 3-D masking; and (v) interactive 3-D modeling. In addition, the software has been designed with a strong, stable, and modular C++ core, and its classes are also accessible via scripting, allowing great flexibility for user-customized visualization and analysis tasks.
Main reference:
Punzo, D., van der Hulst, J. M., Roerdink, J. B., Fillion-Robin, J. C., & Yu, L. (2017). SlicerAstro: A 3-D interactive visual analytics tool for HI data. Astronomy and Computing, 19, 45-59.
BibTeX:
@article{punzo2017slicerastro,
  title={SlicerAstro: A 3-D interactive visual analytics tool for HI data},
  author={Punzo, Davide and van der Hulst, JM and Roerdink, Jos BTM and Fillion-Robin, Jean-Christophe and Yu, Lingyun},
  journal={Astronomy and Computing},
  volume={19},
  pages={45--59},
  year={2017},
  publisher={Elsevier}
}