A Visualization Approach for Monitoring Order Processing in E-Commerce Warehouse
Abstract:
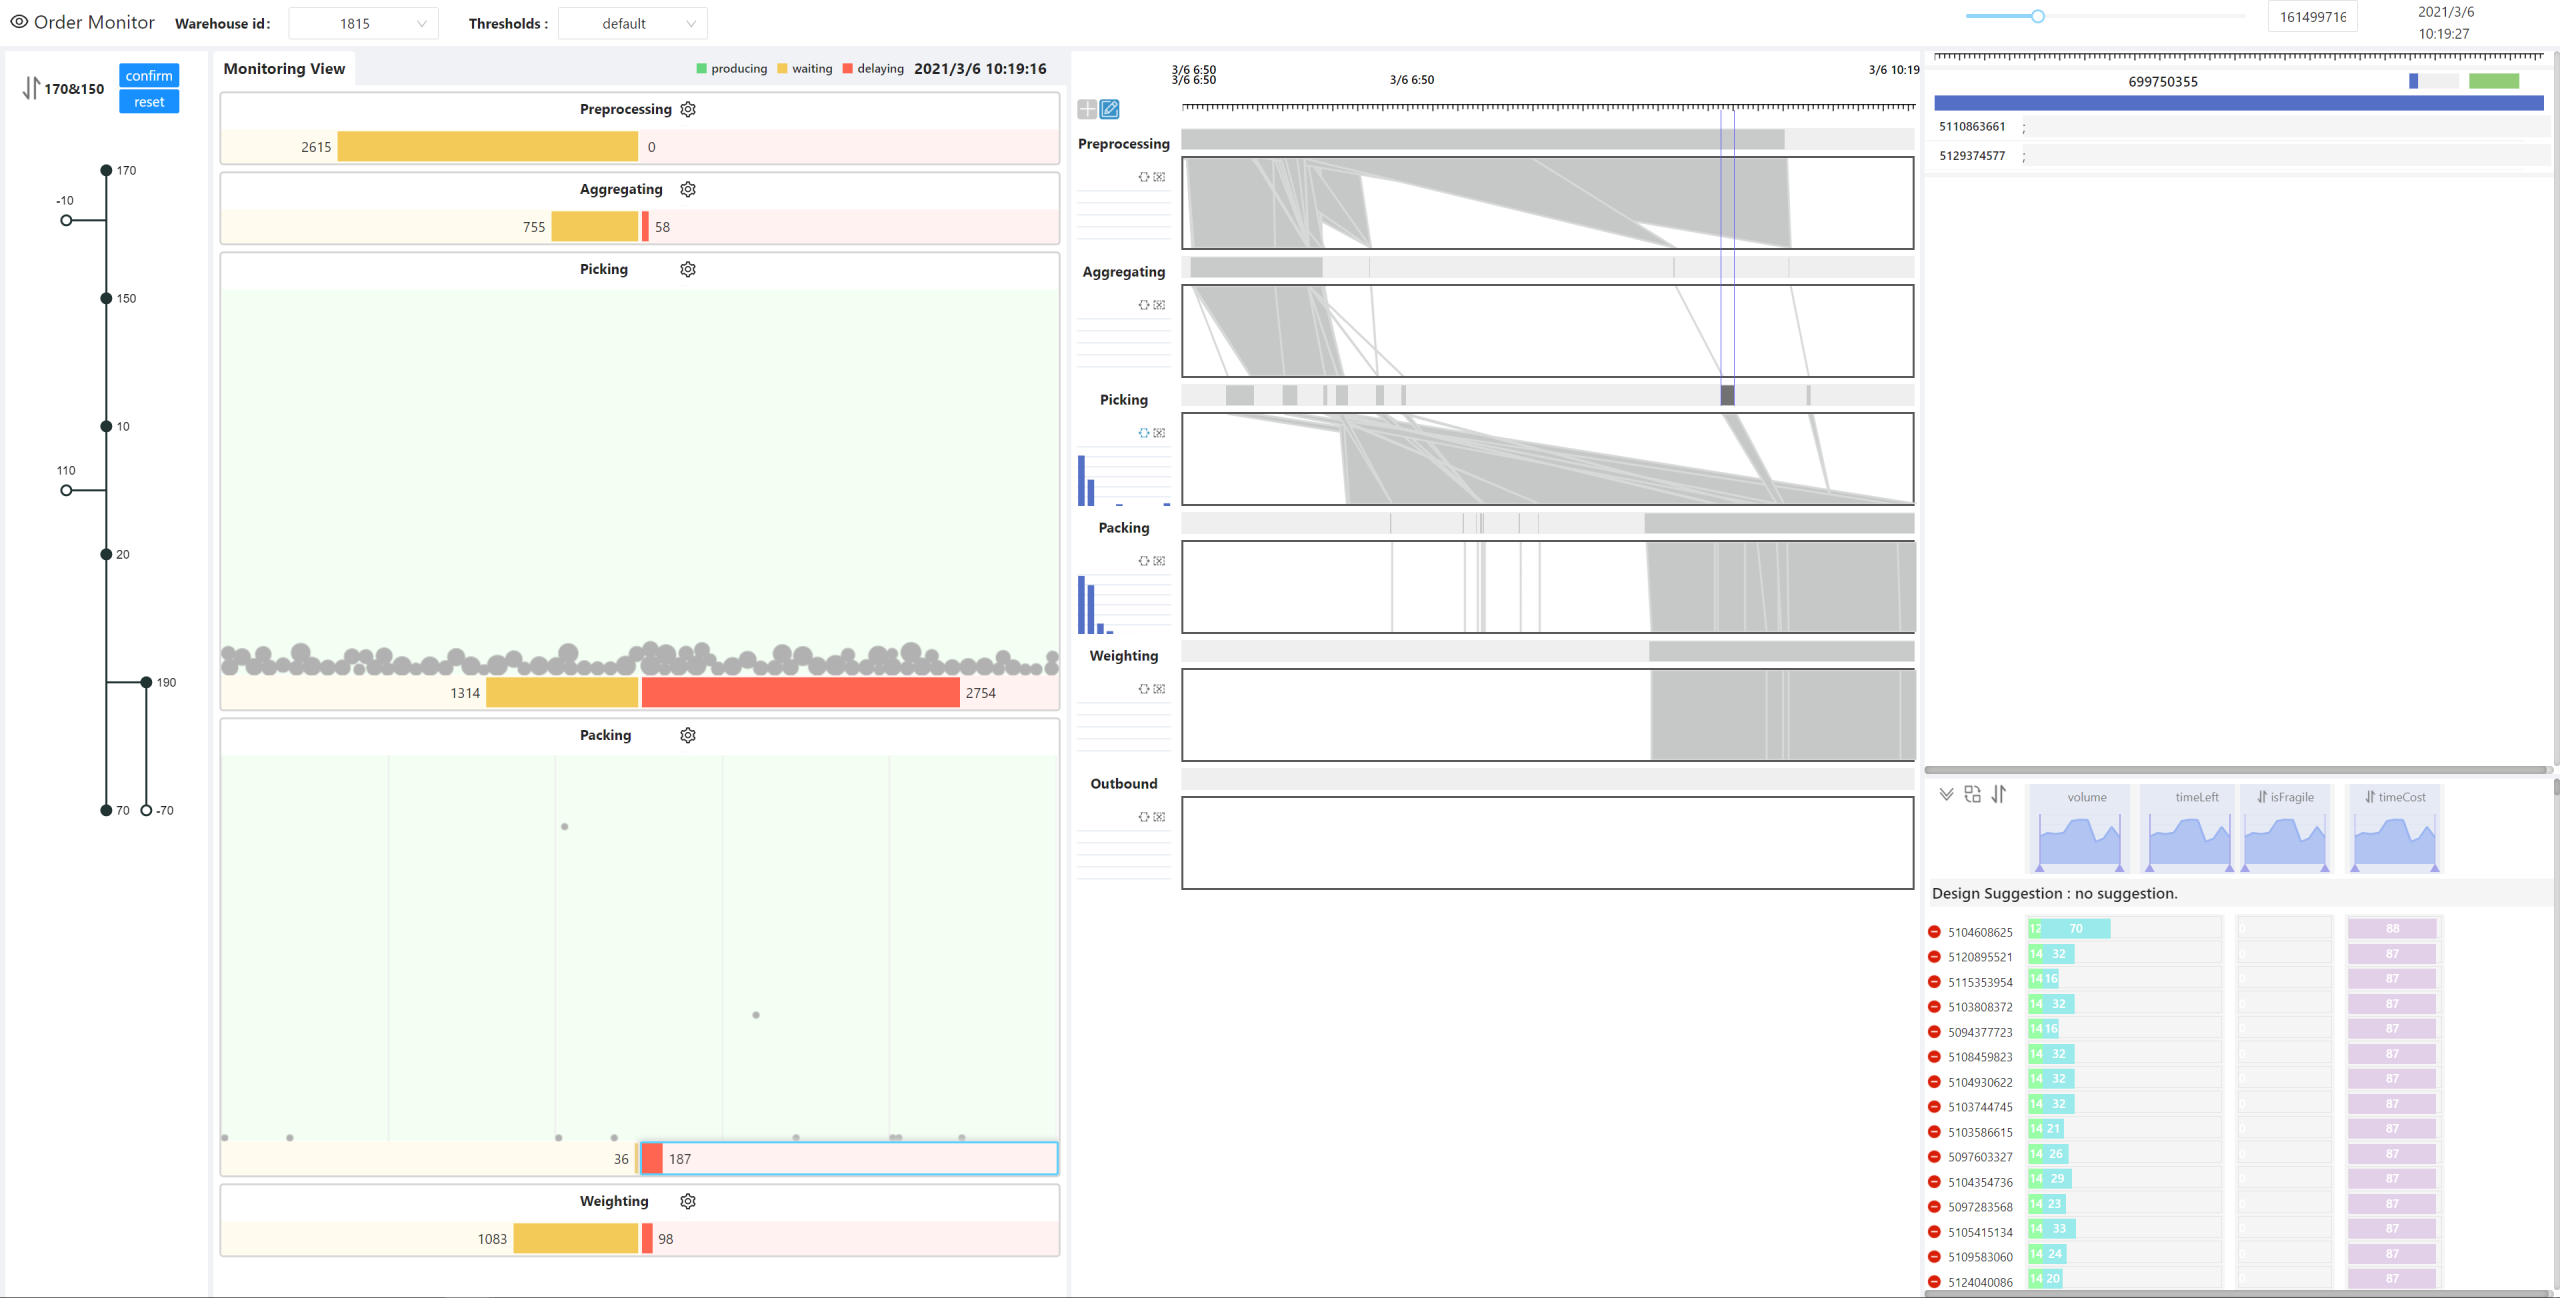
The efficiency of warehouses is vital to e-commerce. Fast order processing at the warehouses ensures timely deliveries and improves customer satisfaction. However, monitoring, analyzing, and manipulating order processing in the warehouses in real time are challenging for traditional methods due to the sheer volume of incoming orders, the fuzzy definition of delayed order patterns, and the complex decision-making of order handling priorities. In this paper, we adopt a data-driven approach and propose OrderMonitor, a visual analytics system that assists warehouse managers in analyzing and improving order processing efficiency in real time based on streaming warehouse event data. Specifically, the order processing pipeline is visualized with a novel pipeline design based on the sedimentation metaphor to facilitate real-time order monitoring and suggest potentially abnormal orders. We also design a novel visualization that depicts order timelines based on the Gantt charts and Marey's graphs. Such a visualization helps the managers gain insights into the performance of order processing and find major blockers for delayed orders. Furthermore, an evaluating view is provided to assist users in inspecting order details and assigning priorities to improve the processing performance. The effectiveness of OrderMonitor is evaluated with two case studies on a real-world warehouse dataset.
Main reference:
J. Tang et al., "A Visualization Approach for Monitoring Order Processing in E-Commerce Warehouse," in IEEE Transactions on Visualization and Computer Graphics, vol. 28, no. 1, pp. 857-867, Jan. 2022, doi: 10.1109/TVCG.2021.3114878.
BibTeX:
@ARTICLE{9557224,
  author={Tang, Junxiu and Zhou, Yuhua and Tang, Tan and Weng, Di and Xie, Boyang and Yu, Lingyun and Zhang, Huaqiang and Wu, Yingcai},
  journal={IEEE Transactions on Visualization and Computer Graphics},
  title={A Visualization Approach for Monitoring Order Processing in E-Commerce Warehouse},
  year={2022},
  volume={28},
  number={1},
  pages={857-867},
  keywords={Data visualization;Monitoring;Real-time systems;Schedules;Delays;Warehousing;Visual analytics;Streaming data;time-series data;e-commerce warehouse;order processing},
  doi={10.1109/TVCG.2021.3114878}}